Data processing
SMILES data processing
SMILES data processing can be largely divided into three steps. Level 1b: observed emission spectrum of the submillimeter-wave region. Level 2: the abundance altitude distributions of each molecule. Level 3: visualized information desired by researchers such as climatology data, diurnal and seasonal variation, which are provided on the Quick look page. The Level 2 and 3 processings are being performed in the NICT Science Cloud computer system.
Level 1b: Submillimeter-wave limb-emission spectrum
Submillimeter-wave radiation from the atmosphere is acquired as an electrical signal by SMILES. This electrical signal is then converted into physically meaningful spectrum data. Specifically, a graph whose vertical axis is for frequency and horizontal axis for radiance is created as a product of this process. Each of atmospheric molecules is known to emit a unique submillimeter wave at a specific frequency (for example, ozone emits a submillimeter wave at 625.371 GHz), so the concentration of the molecules can be estimated by measuring radiance of each frequencies.
- [PDF] S. Ochiai, K. Kikuchi, T. Nishibori, T. Manabe, H. Ozeki, S. Mizobuchi, Y. Irimajiri (2013), Receiver Performance of the Superconducting Submillimeter-Wave Limb-Emission Sounder (SMILES) on the International Space Station, IEEE Trans. Geosci. Remote Sens. 51, 3791-3802, 10.1109/TGRS.2012.2227758
- [PDF]S.Ochiai, T.Nishibori, H.Ozeki, K.Kikuchi, and T.Manabe (2008), Superconducting Submillimeter-Wave Limb-Emission Sounder on the International Space Station I: Radiometric and Spectral Calibration and Data Processing, Journal of the National Institute of Information and Communications Technology, 55(1), 83-95
Level 2: Vertical profile of atmospheric molecular volume mixing ratio
The L2 processing retrieves estimated altitude distributions of abundances for each atmospheric molecule from Level 1b submillimeter-wave limb-emission spectrum. SMILES observes the atmosphere at the atmospheric limb, so the spectrum contains mixed signals from various attitudes. Because the spectrum can not be decomposed fully into attitudes, a strict solution can not be found by analytic method. Accordingly, we estimate the most probable altitude distributions by the use of probabilistic technique called by maximum a posteriori estimation method.
- [PDF] Sato, T. O., Sagawa, H., Yoshida, N., and Kasai, Y.: Vertical profile of δ18OOO from the middle stratosphere to lower mesosphere from SMILES spectra, Atmos. Meas. Tech., 7, 941-958, doi:10.5194/amt-7-941-2014, 2014.
- [PDF] P.Baron, J.Urban, H.Sagawa, J.Moeller, D.P.Murtagh, J.Mendrok, E.Dupuy, T.O.Sato, S.Ochiai, K.Suzuki, T.Manabe, T.Nishibori, K.Kikuchi, R.Sato, M.Takayanagi, Y.Murayama, M.Shiotani, Y.Kasai (2011), The Level 2 research product algorithms for the Superconducting Submillimeter-Wave Limb-Emission Sounder (SMILES), Atmos. Meas. Tech. 4(10), 2105-2124 DOI:10.5194/amt-4-2105-2011
- [PDF] Y.Kasai and S.Ochiai (2008), Super-Conductive Submillimeter-Wave Limb Emission Sounder Onboard International Space Station II: Algorithm Development of for the Data Processing, Journal of the National Institute of Information and Communications Technology, 55(1), 97-108>
Level 3: Visualized data (Ex. Climatology, seasonal variation and global distribution)
Level 2 data has information of the altitude distributions of atmospheric molecules at a certain time in a certain area. By combining the data, we can obtain time variation of molecule abundances in a certain region, and a global map of molecule abundances in a certain time zone, for example.
- [PDF] Kreyling, D., H. Sagawa, I. Wohltmann, R. Lehmann, and Y. Kasai (2013), SMILES zonal and diurnal variation climatology of stratospheric and mesospheric trace gasses: O3, HCl, HNO3, ClO, BrO, HOCl, HO2, and temperature, J. Geophys. Res. Atmos., 118, 11,888–11,903, doi:10.1002/2012JD019420.
- [PDF]Kuribayashi, K., Sagawa, H., Lehmann, R., Sato, T. O., and Kasai, Y.: Direct estimation of the rate constant of the reaction ClO + HO2 → HOCl + O2 from SMILES atmospheric observations, Atmos. Chem. Phys., 14, 255-266, doi:10.5194/acp-14-255-2014, 2014.
Validation
Evaluation of data reliability
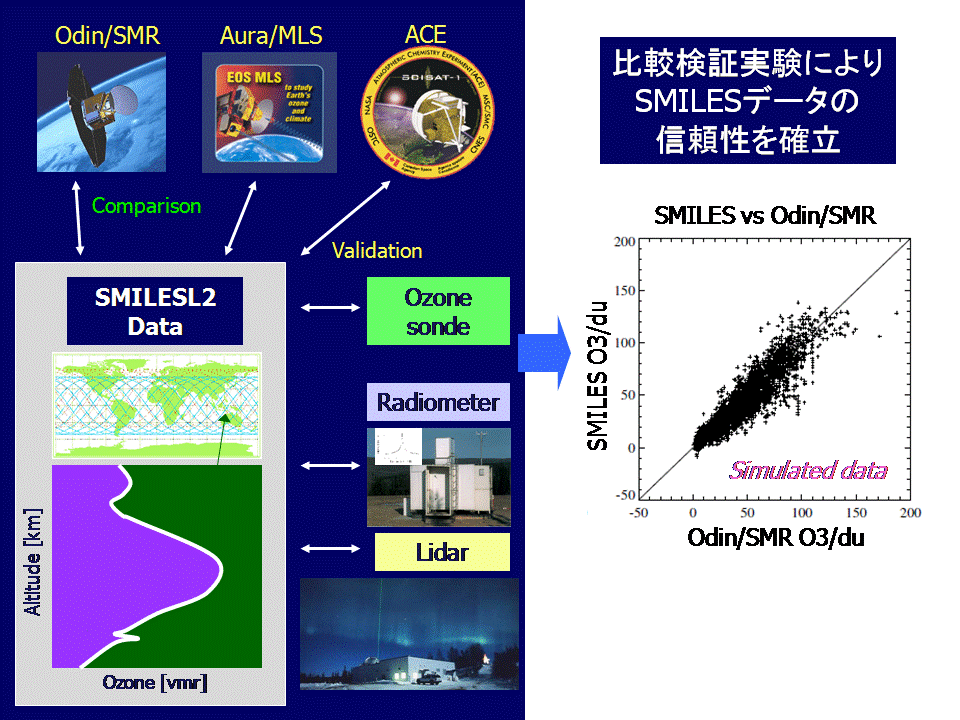
It is important for both data provision side and user side always to be aware of data reliability. Generally in earth observation, unlike an experiment done in a laboratory, we can not confirm the reproducibility of data. Therefore, we evaluate reliability of data by comparing SMILES data with data measured by other instruments at the same place and time, or by investigating factors giving an error to analysis results through simulation.
SMILES mission has no official validation program, SMILES team has conducted data verification on the research basis.

Schematic flow of SMILES data validation
- [PDF] Sugita, T., Kasai, Y., Terao, Y., Hayashida, S., Manney, G. L., Daffer, W. H., Sagawa, H., Suzuki, M., Shiotani, M., Walker, K. A., Boone, C. D., and Bernath, P. F.: HCl and ClO profiles inside the Antarctic vortex as observed by SMILES in November 2009: comparisons with MLS and ACE-FTS instruments, Atmos. Meas. Tech., 6, 3099-3113, doi:10.5194/amt-6-3099-2013, 2013.
- [PDF] Kasai, Y., Sagawa, H., Kreyling, D., Dupuy, E., Baron, P., Mendrok, J., Suzuki, K., Sato, T. O., Nishibori, T., Mizobuchi, S., Kikuchi, K., Manabe, T., Ozeki, H., Sugita, T., Fujiwara, M., Irimajiri, Y., Walker, K. A., Bernath, P. F., Boone, C., Stiller, G., von Clarmann, T., Orphal, J., Urban, J., Murtagh, D., Llewellyn, E. J., Degenstein, D., Bourassa, A. E., Lloyd, N. D., Froidevaux, L., Birk, M., Wagner, G., Schreier, F., Xu, J., Vogt, P., Trautmann, T., and Yasui, M.: Validation of stratospheric and mesospheric ozone observed by SMILES from International Space Station, Atmos. Meas. Tech., 6, 2311-2338, doi:10.5194/amt-6-2311-2013, 2013.
- [PDF] Sagawa, H., Sato, T. O., Baron, P., Dupuy, E., Livesey, N., Urban, J., von Clarmann, T., de Lange, A., Wetzel, G., Connor, B. J., Kagawa, A., Murtagh, D., and Kasai, Y.: Comparison of SMILES ClO profiles with satellite, balloon-borne and ground-based measurements, Atmos. Meas. Tech., 6, 3325-3347, doi:10.5194/amt-6-3325-2013, 2013.
- [PDF] Sato, T. O., Sagawa, H., Kreyling, D., Manabe, T., Ochiai, S., Kikuchi, K., Baron, P., Mendrok, J., Urban, J., Murtagh, D., Yasui, M., and Kasai, Y.: Strato-mesospheric ClO observations by SMILES: error analysis and diurnal variation, Atmos. Meas. Tech., 5, 2809-2825, doi:10.5194/amt-5-2809-2012, 2012.
